
Prepare a Cash Flow Statement in 10 Minutes (Indirect Method)
If you’ve ever looked at your QuickBooks Online reports and wondered why your profit looks healthy but your bank balance feels tight, you’re not alone. This is one of the most common and confusing questions for small business owners. The answer almost always lives inside one report that is often overlooked: the Statement of Cash Flows.
In this guide, you’ll learn how to read and understand the cash flow statement using the indirect method, exactly as QuickBooks Online generates it for you. We’ll walk through how this report connects your income statement and balance sheet, why profit and cash are rarely the same number, and how to use this report to make better decisions about spending, investing, and timing.
This walkthrough is designed to help the cash flow statement finally make sense, even if accounting isn’t your background.
Why Profit and Cash Are Different
Your income statement, also called the profit and loss report, shows whether your business earned or lost money during a period. But it does not tell you when cash actually moved.
You can record sales that haven’t been collected yet, expenses that haven’t been paid yet, and non-cash items like depreciation that reduce profit without touching your bank account. This is why it’s completely possible to show a profit on paper and still feel cash-constrained.
The cash flow statement exists to explain that gap.
Start With the Income Statement
The first line of the Statement of Cash Flows is always net income. QuickBooks pulls this number directly from your profit and loss report for the same period.
This is your starting point, not your ending point.
Before moving further, it’s helpful to look at your income statement alongside your cash flow statement so you can see where that profit number is coming from.
Once you understand the profit number, the rest of the cash flow statement explains why cash moved differently.
How the Indirect Method Works
QuickBooks Online uses the indirect method to prepare the cash flow statement. This means it starts with net income and then adjusts for items that affected profit but did not affect cash.
These adjustments fall into three main sections.
Cash Flow From Operating Activities
This section explains how your day-to-day business activity impacted cash.
QuickBooks adjusts net income for changes in working capital, including accounts receivable, accounts payable, and inventory.
If accounts receivable increases, it means you recorded sales but did not collect the cash yet. That reduces cash flow.
If accounts payable increases, it means you received goods or services but have not paid for them yet. That increases cash flow.
If inventory increases, it means you spent cash to buy inventory that hasn’t been sold yet. That reduces cash flow.
QuickBooks also adds back non-cash expenses like depreciation, since they reduce profit but do not use cash.
After all these adjustments, you arrive at net cash provided by or used in operating activities. This number tells you whether your core business operations are generating or consuming cash.
Cash Flow From Investing Activities
This section captures purchases and sales of long-term assets.
If you buy equipment, vehicles, or computers, cash goes out and appears as a negative number. If you sell an asset, cash comes in and appears as a positive number.
These transactions usually do not affect profit immediately, but they absolutely affect cash.
Cash Flow From Financing Activities
This section explains cash coming from or going to owners and lenders.
Owner contributions, loan proceeds, loan repayments, and owner withdrawals all appear here. These activities often explain large changes in cash that have nothing to do with profit.
The Bottom Line: What Happened to Cash
At the bottom of the cash flow statement, all three sections come together.
You’ll see the net increase or decrease in cash for the period, followed by your opening and closing bank balances. This is the moment where everything should click.
If your cash flow statement is accurate, the ending cash balance will always match the balance in your bank account on the balance sheet.
How to Use This Report in Real Life
The statement of cash flows is one of the most powerful tools for understanding financial health.
It helps you see whether growth is straining cash, whether inventory or receivables are tying up money, and whether financing decisions are supporting or draining the business. Over time, regularly reviewing this report makes cash flow patterns much easier to recognize.
If you ever find yourself asking why your profit and your bank balance don’t line up, this report holds the answer.
Keep Your Cash Flow Reports Accurate
A cash flow statement is only useful if the underlying data is clean. Making sure your books are properly reviewed each month ensures the report tells the right story.
To help with that, I’ve shared a few resources below.
Compare QuickBooks Online Plans
https://www.mycloudbookkeeping.org/quickbooks-plan-comparison
Download the Free Month-End Checklist for Small Business
https://learn.mycloudbookkeeping.org/small-business-month-end-checklist
Book a Free Consultation
https://www.mycloudbookkeeping.org/consultation
If you’re unsure whether your cash flow statement is accurate or want help interpreting what you’re seeing, booking a call can save you a lot of stress and guesswork.
Still need help?
Check this out.
Let's go!Still need help?
Book a session! We can work together to solve your specific QuickBooks Online questions.
Let's go!Hi, Kerry here from MyCloud Bookkeeping. I work with small businesses and entrepreneurs to help them understand their business finances using QuickBooks Online.
One of my favorite clients up in Whistler recently asked me why their profit was so different from the amount in the bank. I love working with this couple, they’re just brilliant. So today, we’re going to look at the cash flow statement using the indirect method.
This is the report that QuickBooks creates for you from the transactions you’ve already entered into your file. It breaks down where your cash has come from and where it’s gone during the period you’re looking at, and it helps explain the difference between your profit and your cash balance.
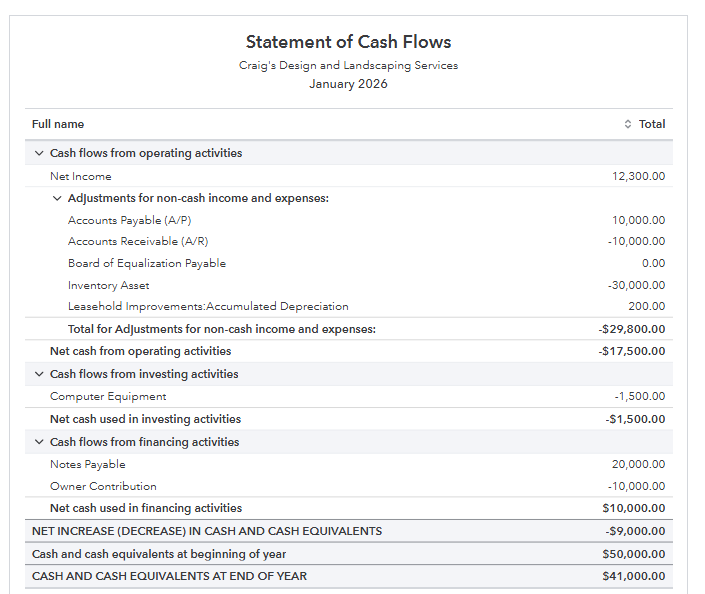
Here we are in the QuickBooks Online sample company, looking at a statement of cash flows. This is a really useful report if you want a better idea of where your cash is coming from and going, and why your net income or profit doesn’t match what’s sitting in the bank.
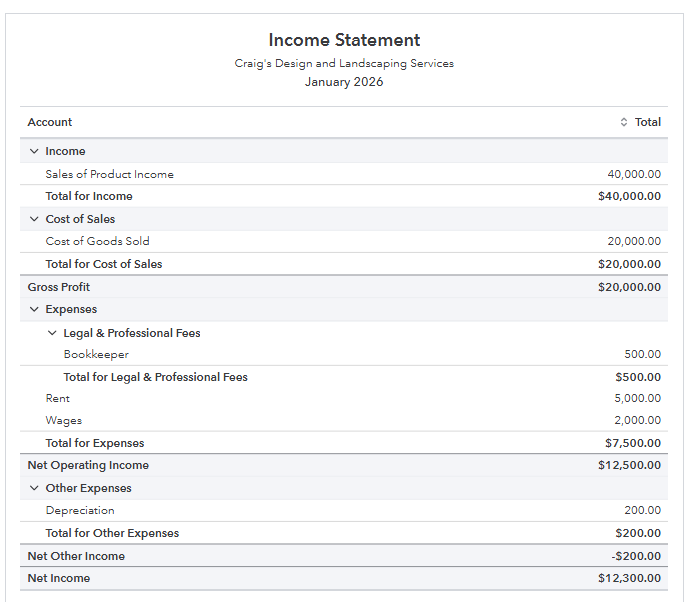
The very first row on your statement of cash flows is net income. In this case, it’s $12,300. Let’s take a look at the income statement for the same period so we can confirm where that number comes from.
Here we have the income statement for January. You can see sales, cost of goods sold, bookkeeping fees, rent, wages, depreciation, and at the bottom, net income of $12,300. Some of these sales may not have been cash sales, we may not have paid for all the cost of goods sold yet, and depreciation has no cash impact at all.
When we go back to the cash flow statement, we see that same $12,300 listed as net income, which is exactly what we expect. Everything else on this report is coming from the balance sheet.
Now let’s look at the balance sheet to understand how those numbers feed into the cash flow statement. We’re running a balance sheet comparison for January compared to December, with QuickBooks calculating the change for us. This is one of the big advantages of using accounting software, everything happens automatically in the background.
After net income, the next section of the cash flow statement adjusts for changes in balance sheet accounts and non-cash items.
First, we see accounts payable increased by $10,000. That means we received goods or services that we haven’t paid for yet. On the balance sheet, accounts payable went from $40,000 in December to $50,000 in January. Because we didn’t pay that $10,000 yet, it effectively increased our cash for the month.
Next, accounts receivable changed. In December, customers owed us $30,000, and in January, they owed us $40,000. That means we made sales that increased our profit, but we didn’t collect the cash yet. This $10,000 increase reduces cash compared to profit.
Then we look at inventory. Inventory went from zero to $30,000. That tells us we spent $30,000 in cash to buy inventory that hasn’t been sold yet. This is another reason profit and cash don’t match.
Next is depreciation. When we depreciate an asset, we’re recording an accounting expense to reflect the use of that asset over time, but no cash actually leaves the business. In this case, accumulated depreciation increased by $200. Because depreciation reduced profit but didn’t use cash, we add it back on the cash flow statement.
Once we adjust for these items, we arrive at net cash from operating activities. In this example, operating activities used more cash than they generated during January.
The next section is cash flow from investing activities. Here, we can see the purchase of computer equipment. On the balance sheet, this shows up as an increase in fixed assets. Since cash was used to buy equipment, this appears as a negative amount in investing activities.
After that, we look at financing activities. In this example, the business received $20,000 from a loan or notes payable, which increased cash. At the same time, the owner contribution decreased by $10,000, meaning the owner was paid back part of their investment.
Finally, we get to the most important part of the cash flow statement: the change in cash. At the end of December, the business had $50,000 in the bank. At the end of January, it had $41,000. The net cash outflow for the month was $9,000.
This confirms that everything ties together. The cash flow statement clearly shows where the cash came from and where it went during the month.
This report is very easy to run in QuickBooks Online. You can find it under standard reports, or simply type “cash” into the search bar and select the statement of cash flows.
The more often you look at this report, the easier it becomes to understand. I recommend reviewing your income statement by month to understand fluctuations, making sure your balance sheet is accurate, and then running your cash flow statement to get a full picture of your business.
This report can help you make better financing and investment decisions. Be sure to check out the downloads below, and if you’d like to see more advanced accounting-style videos like this, let me know in the comments. Don’t forget to like and subscribe, and I’ll see you in the next video. Cheers.
Hi, Kerry here from MyCloud Bookkeeping. I work with small businesses and entrepreneurs to help them understand their business finances using QuickBooks Online.
One of my favorite clients up in Whistler recently asked me why their profit was so different from the amount in the bank. I love working with this couple, they’re just brilliant. So today, we’re going to look at the cash flow statement using the indirect method.
This is the report that QuickBooks creates for you from the transactions you’ve already entered into your file. It breaks down where your cash has come from and where it’s gone during the period you’re looking at, and it helps explain the difference between your profit and your cash balance.
Here we are in the QuickBooks Online sample company, looking at a statement of cash flows. This is a really useful report if you want a better idea of where your cash is coming from and going, and why your net income or profit doesn’t match what’s sitting in the bank.
The very first row on your statement of cash flows is net income. In this case, it’s $12,300. Let’s take a look at the income statement for the same period so we can confirm where that number comes from.
Here we have the income statement for January. You can see sales, cost of goods sold, bookkeeping fees, rent, wages, depreciation, and at the bottom, net income of $12,300. Some of these sales may not have been cash sales, we may not have paid for all the cost of goods sold yet, and depreciation has no cash impact at all.
When we go back to the cash flow statement, we see that same $12,300 listed as net income, which is exactly what we expect. Everything else on this report is coming from the balance sheet.
Now let’s look at the balance sheet to understand how those numbers feed into the cash flow statement. We’re running a balance sheet comparison for January compared to December, with QuickBooks calculating the change for us. This is one of the big advantages of using accounting software, everything happens automatically in the background.
After net income, the next section of the cash flow statement adjusts for changes in balance sheet accounts and non-cash items.
First, we see accounts payable increased by $10,000. That means we received goods or services that we haven’t paid for yet. On the balance sheet, accounts payable went from $40,000 in December to $50,000 in January. Because we didn’t pay that $10,000 yet, it effectively increased our cash for the month.
Next, accounts receivable changed. In December, customers owed us $30,000, and in January, they owed us $40,000. That means we made sales that increased our profit, but we didn’t collect the cash yet. This $10,000 increase reduces cash compared to profit.
Then we look at inventory. Inventory went from zero to $30,000. That tells us we spent $30,000 in cash to buy inventory that hasn’t been sold yet. This is another reason profit and cash don’t match.
Next is depreciation. When we depreciate an asset, we’re recording an accounting expense to reflect the use of that asset over time, but no cash actually leaves the business. In this case, accumulated depreciation increased by $200. Because depreciation reduced profit but didn’t use cash, we add it back on the cash flow statement.
Once we adjust for these items, we arrive at net cash from operating activities. In this example, operating activities used more cash than they generated during January.
The next section is cash flow from investing activities. Here, we can see the purchase of computer equipment. On the balance sheet, this shows up as an increase in fixed assets. Since cash was used to buy equipment, this appears as a negative amount in investing activities.
After that, we look at financing activities. In this example, the business received $20,000 from a loan or notes payable, which increased cash. At the same time, the owner contribution decreased by $10,000, meaning the owner was paid back part of their investment.
Finally, we get to the most important part of the cash flow statement: the change in cash. At the end of December, the business had $50,000 in the bank. At the end of January, it had $41,000. The net cash outflow for the month was $9,000.
This confirms that everything ties together. The cash flow statement clearly shows where the cash came from and where it went during the month.
This report is very easy to run in QuickBooks Online. You can find it under standard reports, or simply type “cash” into the search bar and select the statement of cash flows.
The more often you look at this report, the easier it becomes to understand. I recommend reviewing your income statement by month to understand fluctuations, making sure your balance sheet is accurate, and then running your cash flow statement to get a full picture of your business.
This report can help you make better financing and investment decisions. Be sure to check out the downloads below, and if you’d like to see more advanced accounting-style videos like this, let me know in the comments. Don’t forget to like and subscribe, and I’ll see you in the next video. Cheers.
Still need help?
Check this out.
Let's go!Still need help?
We have what you need. Check out our courses and free resources to get more help managing your finances.
Let's go!